A direct answer
What is a business dashboard and do I need one?
A business dashboard is one screen that shows figures you already track, taken from a source you approve, so you are not rebuilding the same view by hand. You may want one when the same comparisons happen again and again and a person still decides what the figures mean. You do not need one when a single spreadsheet, opened on purpose, already answers the question.
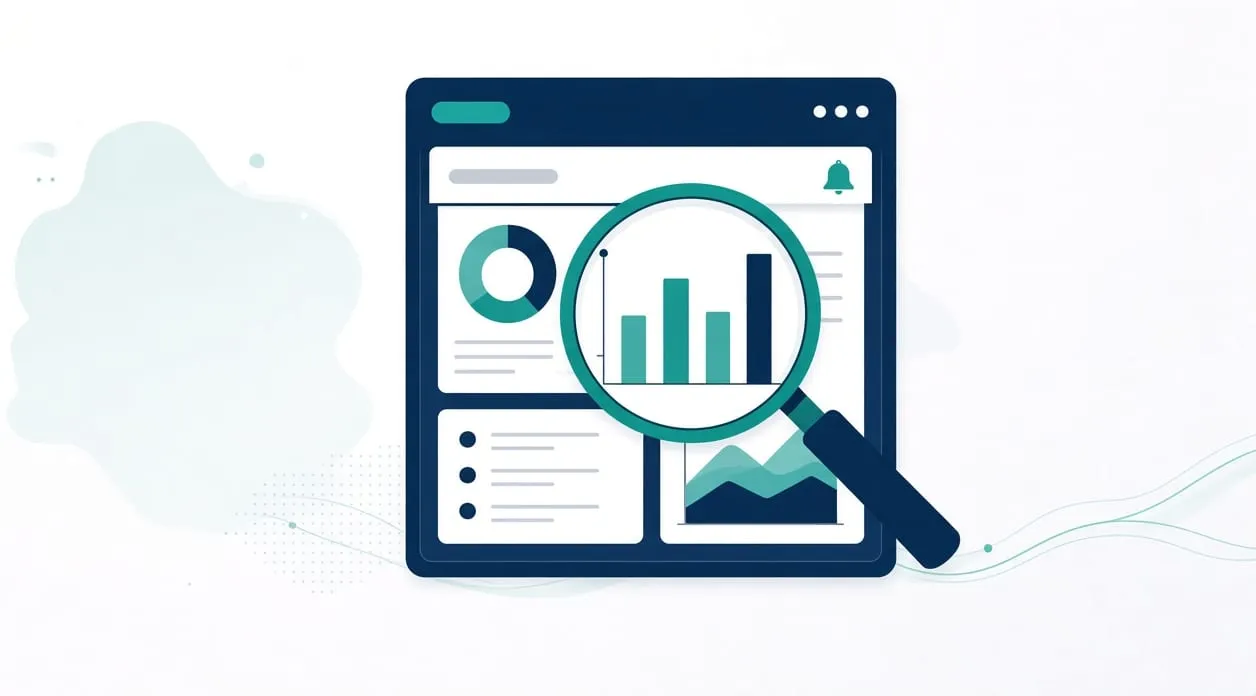
A screen, not a verdict
A dashboard is a view. It gathers figures you have already decided to track and shows them in one place, with a warning when something you defined has been crossed. It does not decide what to do. A person tells an observation from an interpretation.
The closest example on the homepage is the weekly business performance review. The workflow retrieves a fresh approved data export and validates its structure. It compares the latest complete period with the preceding period. It runs deeper checks when thresholds you defined are triggered, and it saves a report. The person reviews data-quality warnings, keeps observations separate from interpretations, and decides which actions to take.
That is the shape I mean by a dashboard or a management report. The screen can be a saved report or a simple view. The value is fewer manual steps in rebuilding the view, not a promise that the business will perform differently.
How to tell whether you need one
Understand the question the screen must answer. “How did this period compare with the one before it?” is a real question. “How is the business doing?” is too vague to build. If you cannot name the figures, you do not have a dashboard yet. You have a wish for reassurance.
Identify where those figures live today. If they live in an export you already trust, the workflow can refresh that export, check that the columns are the ones you expect, and lay out the comparison. If they live only in someone’s memory, a dashboard would invent precision. Do not build that.
Build the smallest view that answers the question. Include the comparison you actually use. Include a visible warning when the export fails the structure check or when a threshold you wrote down is crossed. Leave out decorations that do not change a decision.
Test it against a period you have already reviewed by hand. The figures should match the hand review. If they do not, the view is wrong, even if it looks calm. Also test a broken export: a missing column, an empty file, a partial period. The screen should show the problem, not a tidy chart of nothing.
Improve the view only when real use shows a figure you keep ignoring or a warning you keep needing. Adding every number you can find makes the screen harder to read. Stopping the copy between spreadsheets is often the real project underneath a dashboard request. If the figures are still typed in by hand, fix the source before you decorate it.
What you still do yourself
You choose the thresholds, read the warnings, and decide the action. Observations and interpretations stay separate, as the homepage already says.
A small custom app can be the right home for this view when the tools you already use cannot hold the comparison without another round of copying. Often they can. When a custom micro-app makes sense is the test for that choice.
When it is not worth it
Do not build a dashboard when you open one spreadsheet a few times and it already answers the question. A second screen would be another place to maintain.
Do not build a dashboard when the export is not approved or not fresh. A pretty view of a stale file is worse than the file, because it looks finished.
Do not build a dashboard to avoid a conversation about which figures matter. Agree the figures first. And do not expect the screen to make a hiring, pricing, medical, legal, or tax decision. It can place the numbers you asked for. A qualified person decides what they justify.